
CASTLE 1
Improving mobility is a primary goal for rehabilitation. However, how do we measure when a patient has reached their full potential?
The PLUS-M™ is a patient-reported outcome measure of mobility specific to individuals with lower limb amputation. The PLUS-M™ utilizes T-scores, where a T-score = 50 is representative of the population average of 1,000 representative lower limb prosthesis users1. However, a T-score = 50 may not be the most appropriate goal as we know that factors such as age, amputation level, and etiology impact mobility.
The PLUS-M™ mobility curves2 allow clinicians and rehabilitation professionals to better set goals with their patients.
How to Use
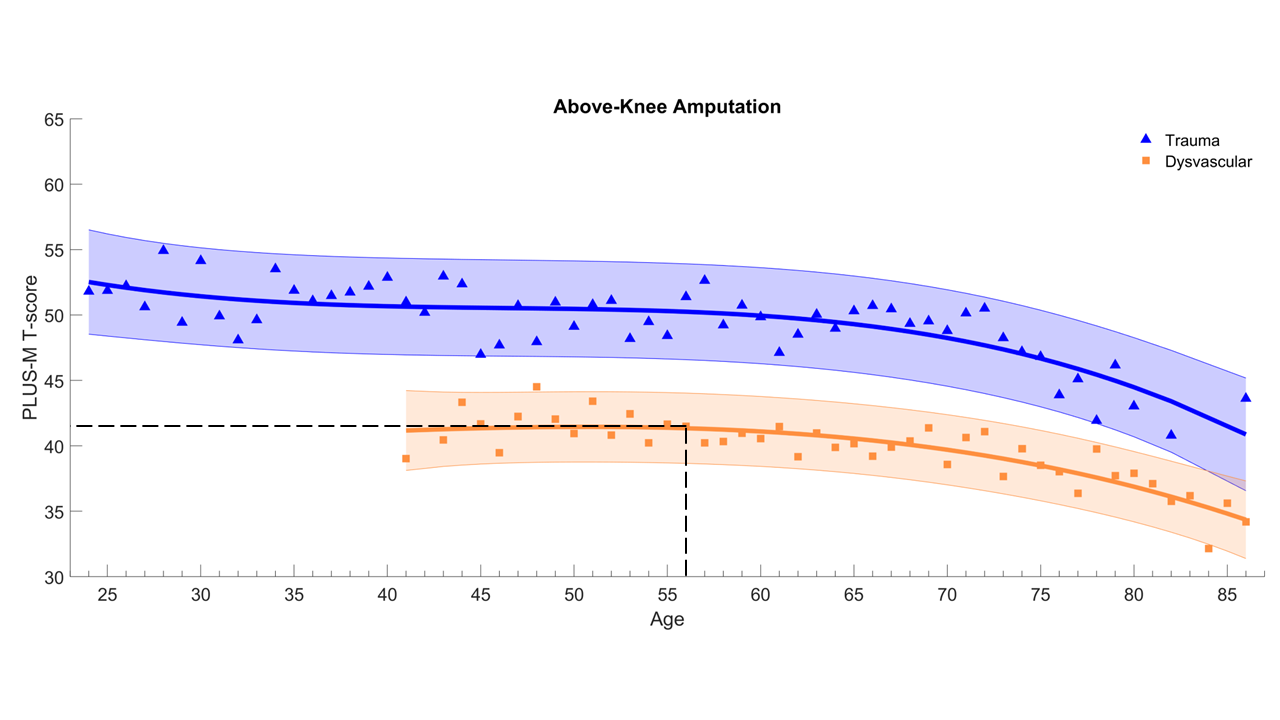
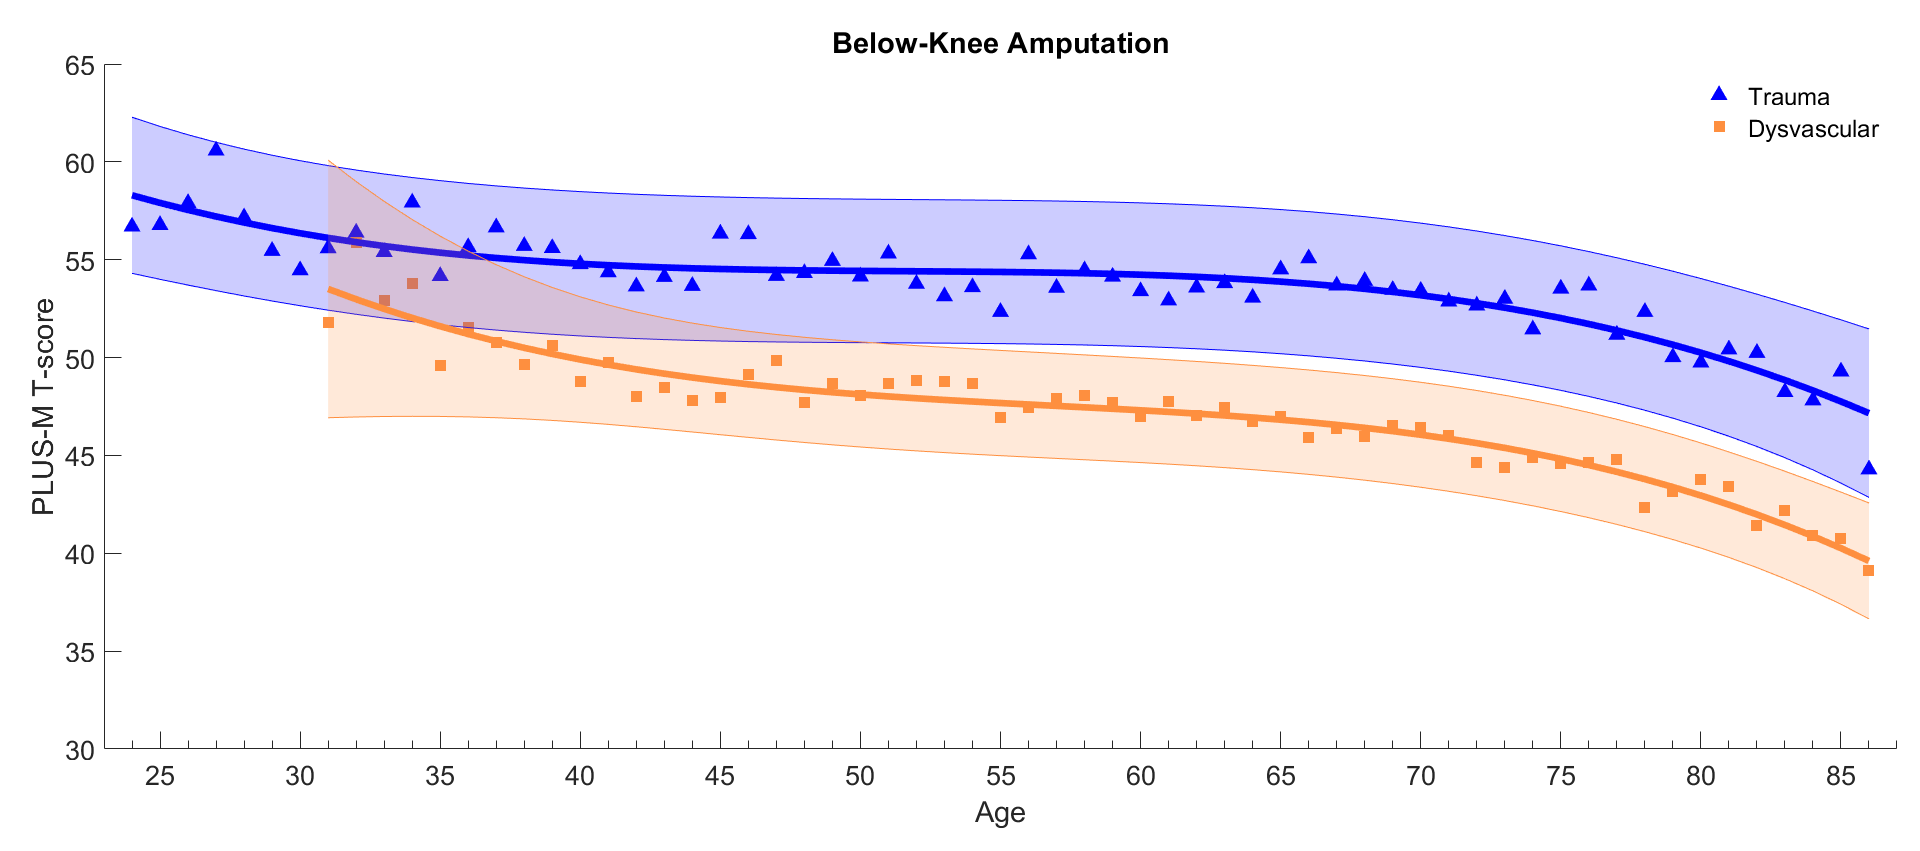
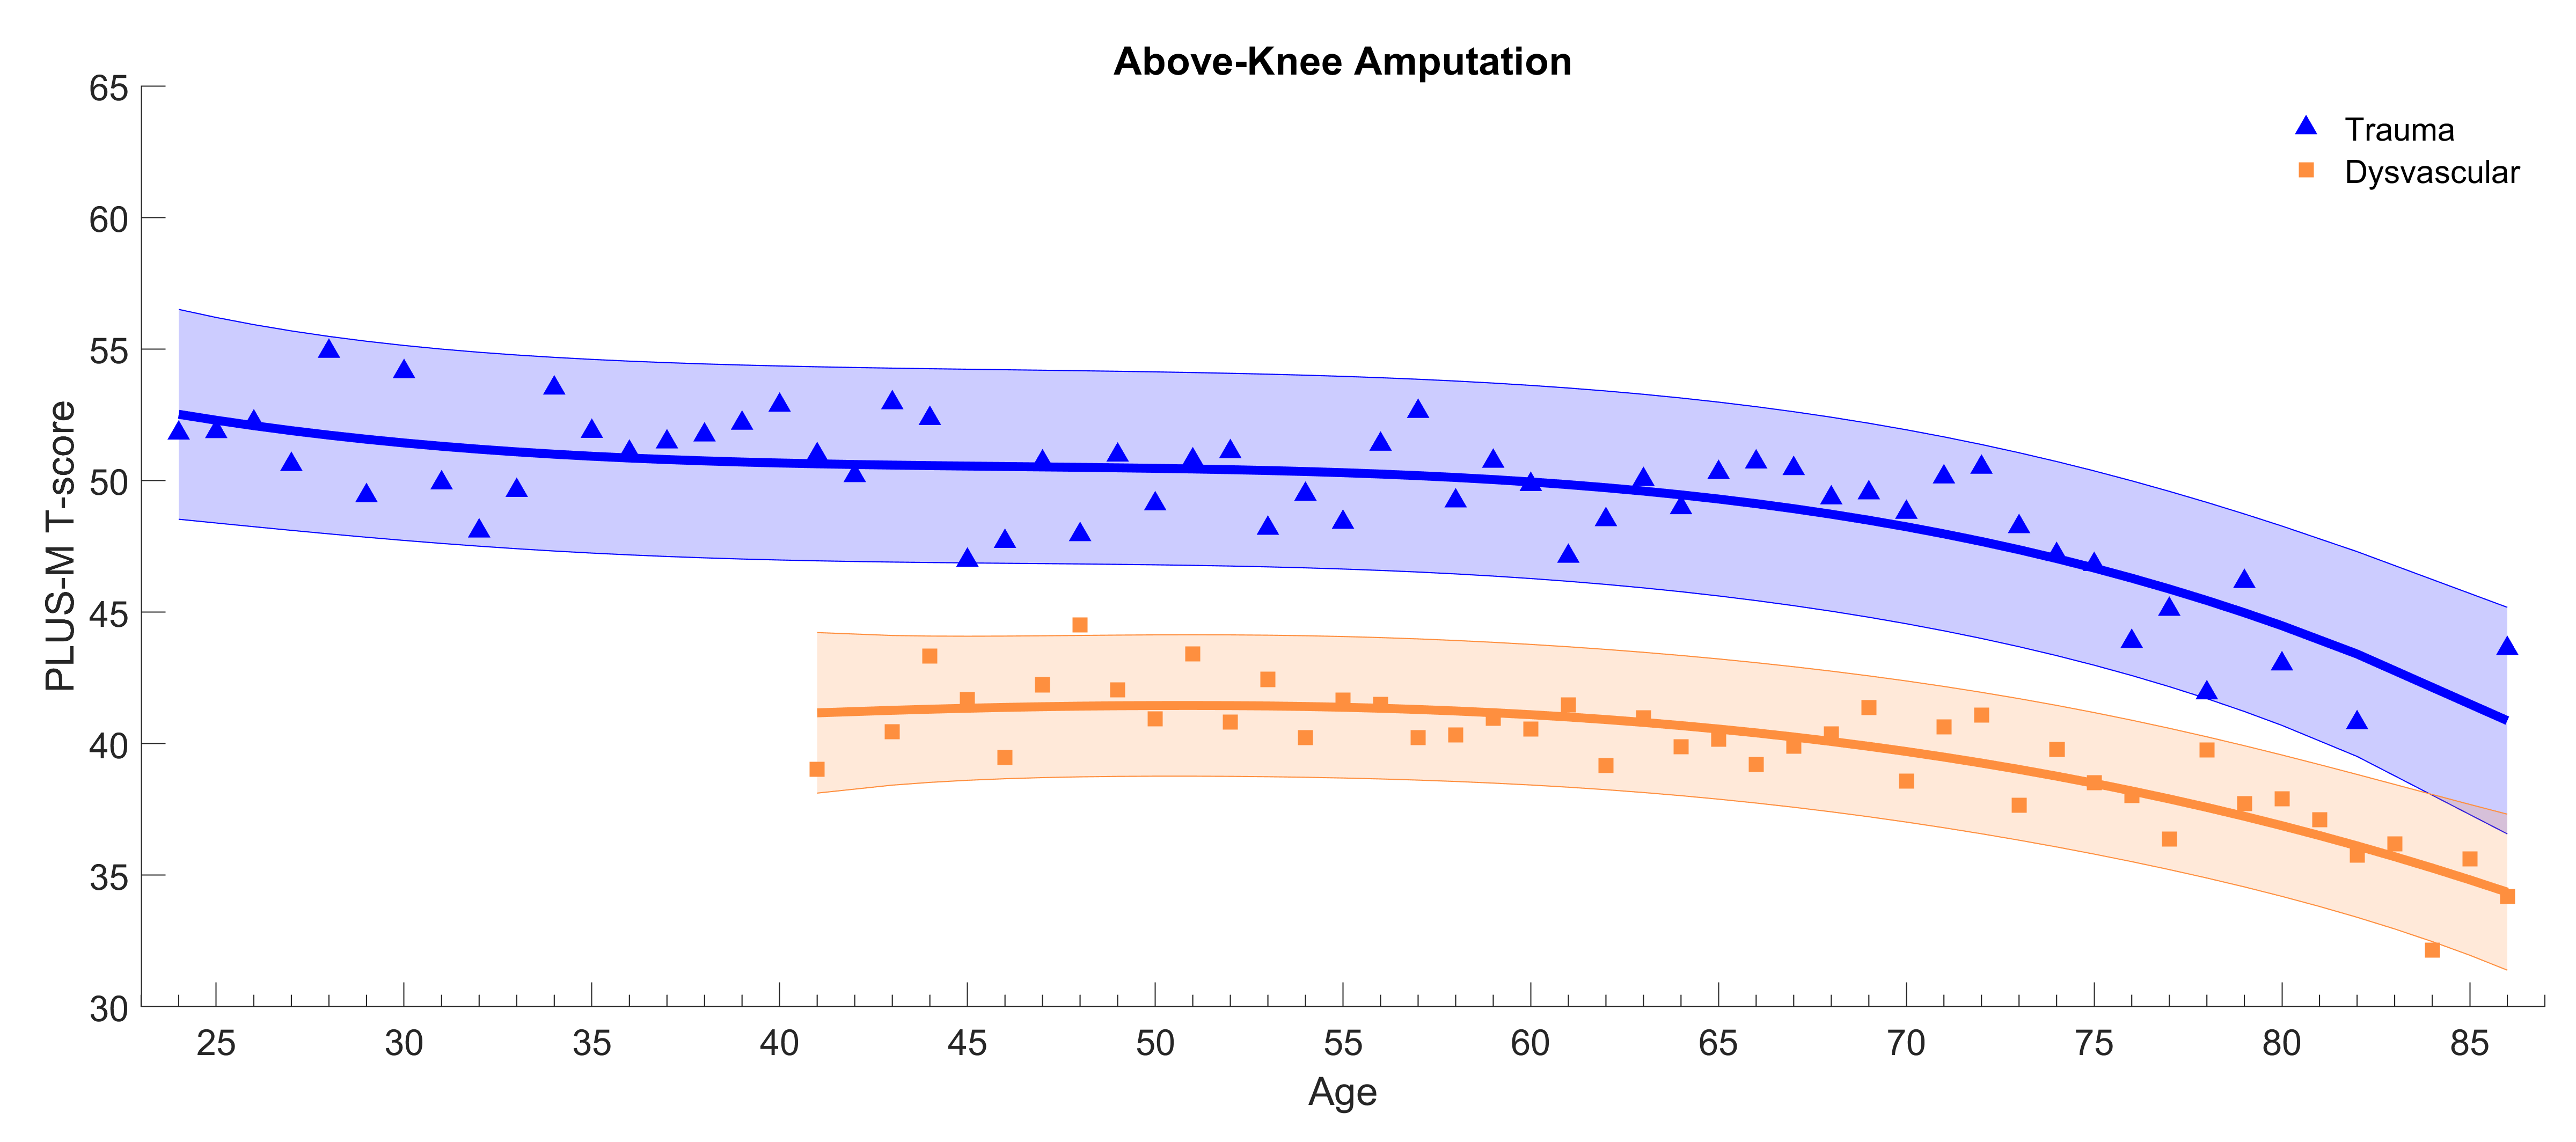
- Select the mobility curve chart based on amputation level
- Draw a vertical line at the patient’s age across the x-axis
- Draw a horizontal line from where the vertical line touches either the blue or orange line (depending on etiology of the patient)
- The PLUS-M™ T-score on the y-axis is the average T-score for a patient of similar age, amputation level, and etiology
Considerations
- Sex additionally influences mobility – a patient’s mobility goal may vary slightly from the mobility curves based on their sex.
- To run this analysis, we used data from 29,522 unique patients. Each dot on the curves has the average of at least 15 patient’s scores. In instances where we had less than 15 patients, the data were excluded. The datapoints at 24 years of age include data from individuals 18-24 and the data at 86 includes individuals 86 and older. Some curves are shorter because there was not enough data to complete the curve across all age bins (e.g., under 40 years old for individuals with above-knee amputation due to dysvascular etiology)
- Individuals with amputation due to cancer or those with congenital limb difference or amputation are expected to follow the curves similar to the trauma etiology. From our previous research3, these etiologies were the most similar; however, we did not have enough patient data to expand to single years of age.

- Hafner BJ, Amtmann D, Morgan SJ, Abrahamson DC, Askew RL, Bamer AM, Salem R, Gaunaurd IA, Gailey RS; Collaborators (PLUS-M Advisory Panel); Czerniecki JM, Fatone S, Fergason JR, Fothergill I, Kelly VE, Weber EL, Whiteneck GG. Development of an item bank for measuring prosthetic mobility in people with lower limb amputation: The Prosthetic Limb Users Survey of Mobility (PLUS-M). PM R. 2023 Apr;15(4):456-473. doi: 10.1002/pmrj.12962. Epub 2023 Mar 31. Erratum in: PM R. 2024 May;16(5):524. doi: 10.1002/pmrj.13041. PMID: 36787171; PMCID: PMC10121932.
- Fylstra BL, England DL, Stevens PM, Campbell JH, Wurdeman SR. Creating Adjusted Scores Targeting mobiLity Empowerment (CASTLE 1): determination of normative mobility scores after lower limb amputation for each year of adulthood. Disabil Rehabil. 2024 May;46(9):1904-1910. doi: 10.1080/09638288.2023.2208376. Epub 2023 May 18. PMID: 37203194.
- England DL, Miller TA, Stevens PM, Campbell JH, Wurdeman SR. Mobility Analysis of AmpuTees (MAAT 7): Normative Mobility Values for Lower Limb Prosthesis Users of Varying Age, Etiology, and Amputation Level. Am J Phys Med Rehabil. 2022 Sep 1;101(9):850-858. doi: 10.1097/PHM.0000000000001925. Epub 2021 Dec 6. PMID: 34864771; PMCID: PMC9377488.
Additional Research
- Related to Lower Limb Prosthetics:
- QOL and satisfaction are strongly related to mobility
- Individuals with multiple comorbid health conditions do not necessarily have decreased mobility
- Patients with dysvascular disease or diabetes who remained engaged in the prosthetic care as far out as 7 years post-amputation had high QOL, satisfaction, and mobility
- Earlier prosthesis receipt (0-3 months post-amputation) is associated with decreased total healthcare costs and fewer emergency department visits in the first year after amputation
- Below-Knee Specific:
- Above-Knee Specific: